

When imperfect data is your friend
When imperfect data is your friend
The right questions to ask when you think you need more data

Despite how much emphasis is currently placed on algorithms and data analytics, we don’t see enough discussions about how much accuracy/precision is required of the data we use to inform our actions and decisions.
In some cases, this is a non-issue. For example, with quantitative data like new customers, renewals, errors per 100 shipments, it’s typically possible to get a 100% complete count without incurring in prohibitive costs or having to worry about things like confidence intervals.
In other scenarios, data may suffer from many imperfections, including inaccuracy, inconsistency, and incompleteness. The key thing to keep in mind is good decisions rarely, if ever, require flawless data. And sometimes it’s perfectly fine to keep going without waiting (or paying) for data of higher quality than we currently have.
The trick is to “begin with the end in mind” so you can tell when it’s critical to invest in more or higher quality data, and when it’s not.
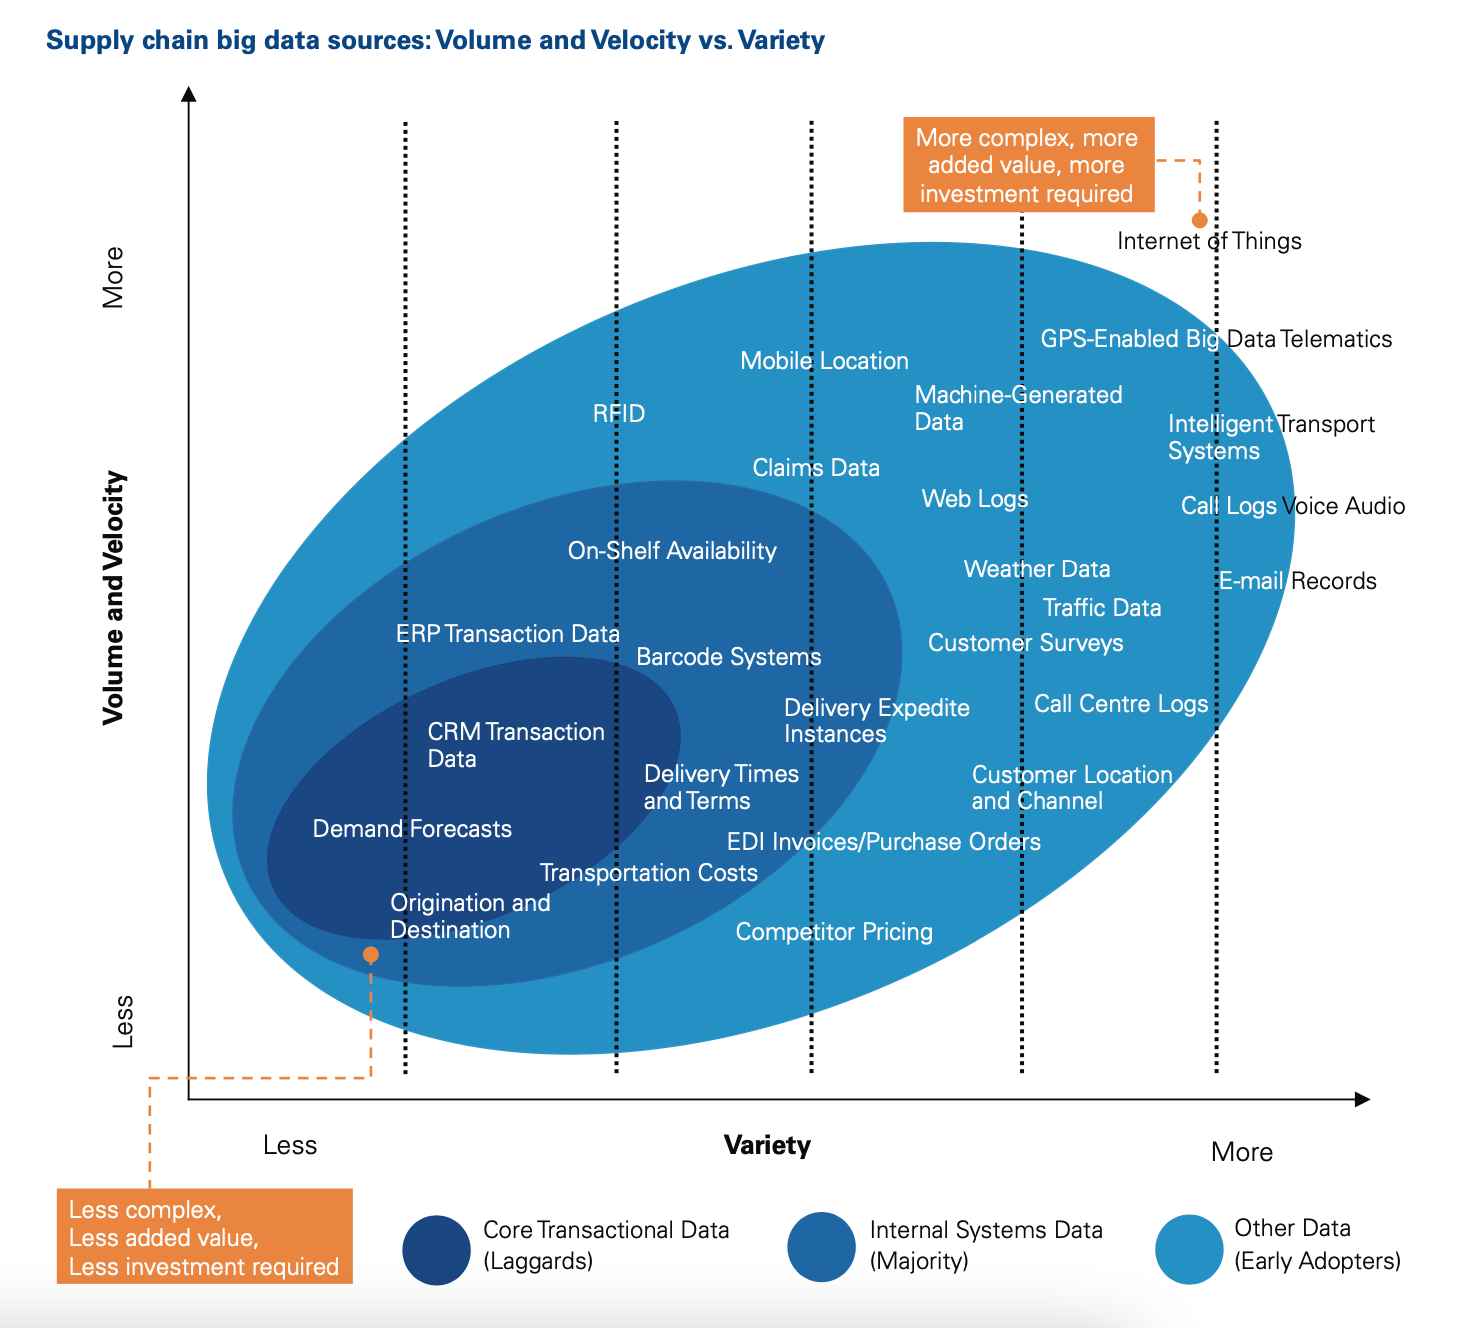
A typical illustration that emphasizes complexity, value and investment required to produce data (here focusing on supply chain). Other important distinctions (not shown) are whether the data is objective, accurate, and complete (e.g., Origination and Destination), mostly subjective, qualitative, and non-representative (Customer Surveys), or better represented by ranges and probabilities (Demand Forecasts). Source: KPMG , Jun 2018).
When incomplete data is a problem…
In a temporary shelter, if things get busy, a case worker may fail to capture details like the number of times a new shelter guest has been homeless over the past three years. This can be problematic when that variable is a strong predictor of the risk that an individual will return to homelessness, and you’re trying prioritize the shelter guests who must receive extra help to succeed. Here, investing in mechanisms to ensure completeness (like making it a required field during check-in) may be critical to ensure the data is actionable.
… And when it isn’t
Let’s say you need data to support a decision of whether or not to build a new feature for an online store. Leadership management has concluded that to justify the initiative, at least 55% of the customers of the brick-and-mortar store need to use the online store. You ask a sample of 100 customers in the store whether they have visited the online store, and 34 say yes. Making some reasonable assumptions about the universe of store customers, you’re able to establish a 90% confidence interval of 26% to 42%.
Because of incomplete data, you only have a range and probability (the 26-42% range has 90% chance of containing the correct percentage of customers who use the online store). While the survey finding could still be wrong, the probability of the real value being 55% or more is small enough that the survey data can be reasonably used for a final decision not to build the new feature. There would be no point in adopting an expensive and over-formalized process when a simpler shortcut was sufficient to answer the business question.
Imperfect data may be “good enough” in many scenarios
Imagine that you sell physical products and are trying to lower risks by understanding your target market to come up with an optimal product mix. You decide to create a survey to get feedback from existing and prospective customers.
Statistical tools can be used to estimate how many people you need to respond to your questionnaire to have a “statistically significant data set”, but sadly, in real-life things are rarely that simple.
The results extracted from a sample may not reflect the results you would get from the entire group if the people willing to take your survey is heavily skewed toward a segment like users with a high degree of technical literacy or the most vocal critics of your product or company. Important segments of your target audience may be significantly underrepresented in your sample.
Setting the problem of sampling error aside, imagine that one of the questions is whether the customer is willing to pay an extra dollar for a product that is eco-friendly, and 75% of respondents answer yes.
In psychology and behavioral science, study after study has shown that people are really bad at predicting their future behavior. All those respondents might even think they are answering accurately when in fact they based their answer on an "idealized and aspirational version of the self". The majority of them might still choose the regular version for $21.99 as opposed to the eco-friendly version for $22.99 when doing checkout later.
Even objective questions for which we’d expect a quantitative answer, like “How much time do you spend using the internet every week?” do not guarantee accurate responses, no matter how well-intentioned the survey takers are. (For example, research from psychologists at the University of Kent found that the way people perceived time varied according to whether their internet use was specifically Facebook related or more general.)
The sources of inaccuracy in survey data don’t stop there. Sometimes incorrect responses may be the result of people just trying to be polite. In her book Lean Customer Development, Cindy Alvarez reports hearing from a user, “When I give feedback in surveys, I try to only say as many negative things as I can say a nice thing to balance it out." Her reaction was spot on: "Yikes. Presumably the worse your product is, the less honesty you'll get from her."
But the fact that customer surveys tend to have lots of imperfections doesn't mean they are useless. There is a lot you can learn from them, especially when they are:
1) used to reduce uncertainty rather than to provide an exact answer;
2) carefully designed to minimize bias; and
3) analyzed in a way that recognizes the direction toward which feedback is biased.
For a costly decision such as whether to invest in developing an eco-friendly version of a product, a superior approach might be to ask a subset of customers to pay in advance for the item (or come up with another method to measure level of interest more reliably than customer surveys).
However, if the goal is simply to learn whether a segment of customers finds the idea appealing, an open question that respondents can choose to answer or not may be sufficient to provide enough information. The percentage of people who opt to provide a lengthy answer vs. skip the question (or only write a few words) can be taken as a good indication of how important the concept is for the target audience. Based on the initial reaction, the company could decide if more resources should be allocated to investigate how big of an opportunity eco-friendly products truly are.
The key takeaway here is that the level accuracy/precision that data must have in order to add value depends on the questions you are attempting to answer, and on the impact that a wrong decision might have in the business.
When deciding what data you truly need, start from the important questions:
What is the real problem/decision/dilemma?
What about that problem really needs to be measured, and to what degree of accuracy/precision?
Don’t make the mistake of thinking that more data, or higher quality data, is always important or more desirable. Suspect any unsupported claims that imperfect data isn’t sufficient for a new investment or decision. We always have more data than we think we have, and sometimes we just need to know that a percentage is higher or lower than 55%, not its exact value.